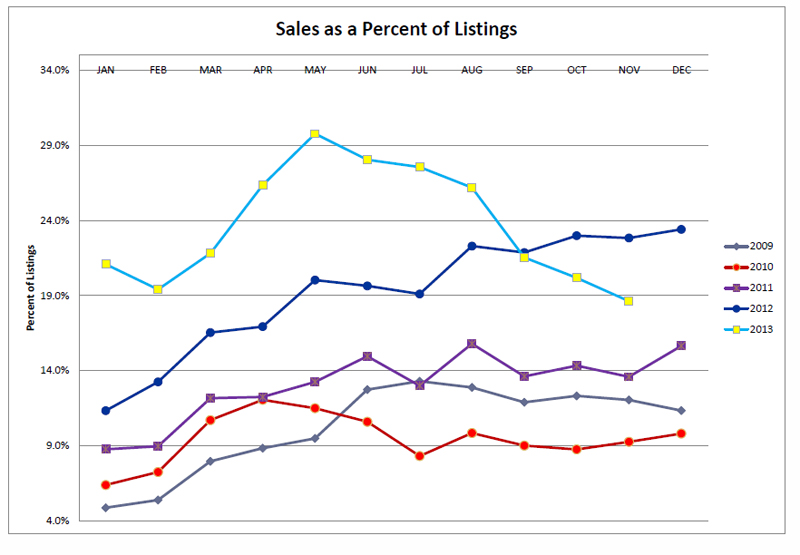
This "Sales as a Percent of Listings" graph is compiled from the Utah County
Association of Realtors. This graph shows the percentage
of Utah County Listings Sold over the past few years. Each dot represents
the percentage of homes sold in any particular month
ranging from 2009-2013.
Out-of-state bankers that are wanting to list a bank
foreclosure ask me what the saturation rate is in Utah
County. The saturation rate is an indication of how long
it is taking for buyers to buy the current inventory.
For example. If the saturation rate is 25% or 25 homes
out of 100 being sold every month, then it is taking 4
months to sell your average home in Utah County.
The
percentage of Utah County Listings Sold changes each
month. The scatter plot does show a general direction in
the market that appears to change by the season and
market conditions. If you want to watch the Utah County
Real Estate market keep an eye on this graph. You may
want to bookmark this page and visit it about every
quarter. We will update how the market is changing. If
you follow the youtube link a video will appear with my
latest quarterly evaluation of the current market
conditions.
Yearly Review of the Utah County
Listings Sold
2013 - What a
record! In May of 2013 we had around 30% of the listing
sold in Utah County sell. This is about as high as
it ever gets. I have been watching these charts since
1995 and I don't ever remember hitting 30%. Anything
above 20% and our market is hot. I anticipate this
number to stay under 20% in 2014.
2012 - The Utah
County Real Estate market went nuts in 2012. The buyer's
returned to the market and the percentage of homes sold
broke out above 19%. The percentage of homes sold hit a
record high of 22%. This means the average home was
taking a little over four months to sell compared to an
earlier 20 months to sell in 2008. We have now turned to
a neutral or slight sellers market.
2011 - This is the year things started to really change. The Utah County Real Estate Inventory dropped from 3,880 homes for sale down to 3,050 homes for sale. Bargain shoppers came pouring into the Utah County real estate market. We finally broke the 14% of Utah County Listings Sold resistance level. This means our saturation rate moved to (100/14) around 7 months. The average home was now taking 7 months to sell a home in Utah County. The number of Utah County Listings Sold had drastically improved.
2010 - Many Realtors experienced their slowest selling summer ever in 2010.
This is a slow year for the number of listings sold. The governement tax incentive rushed many buyers into the market early. You can see the percentage of homes drop in the summer of 2010.
2009 - In the summer was saw a significant surge
in listings sold. In July 2009 the Realtors in Utah County managed to sell around 575 homes. More than 50% of those homes sold were bank foreclosures and short sales. The percentage of Utah County Listings Sold seemed to slightly improve in comaprison to the previous two years.